Residential home sales activity recorded through the MLS® for the Niagara Association of REALTORS® (NAR) totaled 565 units in May 2026, compared to 627 in May 2025. In May , the Niagara Association of REALTORS® listed 1574 residential properties compared to 1925 in May 2025. The average days it took to sell a home in May 2026 was 41 days, a 5.1 % increase from May 2025.
Residential Sales by MunicipalityMay 2026May 2025Benchmark Price by MunicipalityMay 2026May 2025
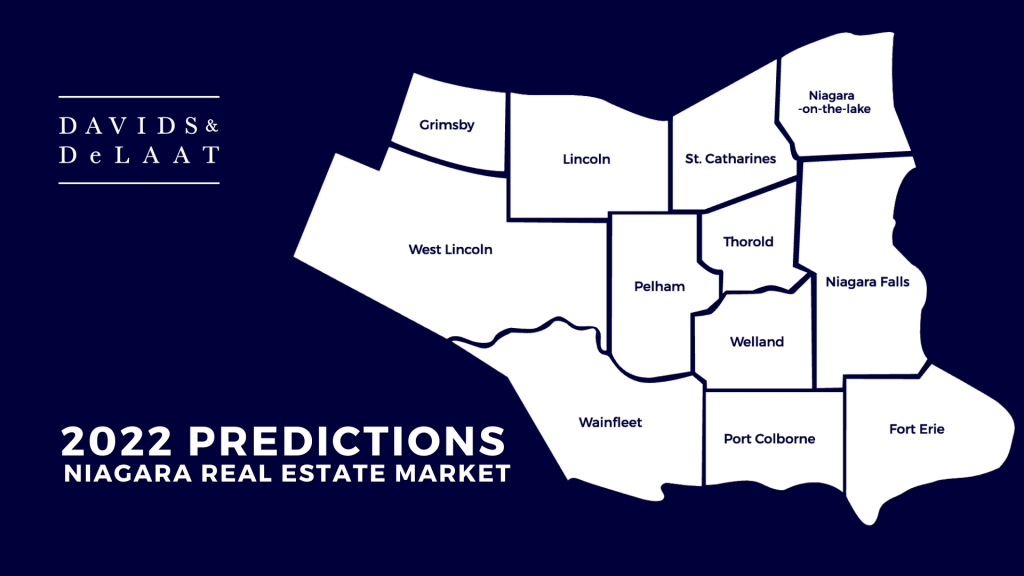
Year-over-year by municipality
Municipality
New Listings
Sales
Benchmark Price
Avg Days on Market
May 2026
May 2025
May 2026
May 2025
May 2026
May 2025
May 2026
May 2025
Fort Erie
156
182
55
59
$492,200
$545,900
52
57
Grimsby
100
142
32
34
$679,500
$723,300
29
32
Lincoln
94
106
32
39
$671,900
$747,900
35
37
Niagara Falls
280
352
85
93
$562,900
$609,100
40
38
Niagara-on-the-Lake
109
122
40
31
$861,300
$945,000
52
36
Pelham
63
82
24
23
$765,200
$846,800
38
36
Port Colborne/Wainfleet
92
113
29
38
$474,100
$527,300
40
62
St. Catharines
384
403
162
182
$527,500
$557,500
36
26
Thorold
102
153
28
40
$578,200
$653,700
46
30
Welland
176
244
64
77
$503,200
$563,400
38
40
West Lincoln
18
26
14
11
$680,900
$749,400
47
30
Niagara Totals
1,574
1,925
565
627
$575,300
$625,500
41
39
“With Niagara’s sales-to-listings ratio for May landing at 36%, our regional market is staying firmly planted in a buyer’s market”
Niagara market FAQ — May 2026
What is the average home price in Niagara in May 2026?
The MLS® HPI composite benchmark price across the Niagara region was $575,300 in May 2026, compared to $625,500 in May 2025 (−8.0% year over year).
How many homes sold in Niagara in May 2026?
There were 565 residential sales across the Niagara Association of REALTORS® in May 2026, compared to 627 in May 2025.
How long are homes taking to sell in Niagara?
Homes took an average of 41 days to sell in May 2026, versus 39 days in May 2025.
How many new listings came on the market in May 2026?
1,574 new residential properties were listed across Niagara in May 2026, compared to 1,925 in May 2025.
Which Niagara municipality had the highest benchmark price in May 2026?
Niagara-on-the-Lake had the highest MLS® HPI benchmark price in May 2026 at $861,300.
The Residential Market Report includes listings for both Residential Freehold and Residential Condo & Other property types. (Excluding multifamily, land or farm properties.)
Source: May 2026 Market Release & Stats, Niagara Association of REALTORS®. Figures are transcribed verbatim from the official monthly report and are updated automatically as each new report is released.
Resources
Market reports & analysis
The Davids & DeLaat team’s ongoing read on the Niagara real estate market — inventory, sales activity, and what the numbers mean for buyers and sellers.